The Most Accessible US City? A three city comparison.
How TRACC works
TRACC uses its powerful algorithms to analyze public transit, highway and census data to determine the travel time from many origins to many destinations, to calculate how many people can travel.
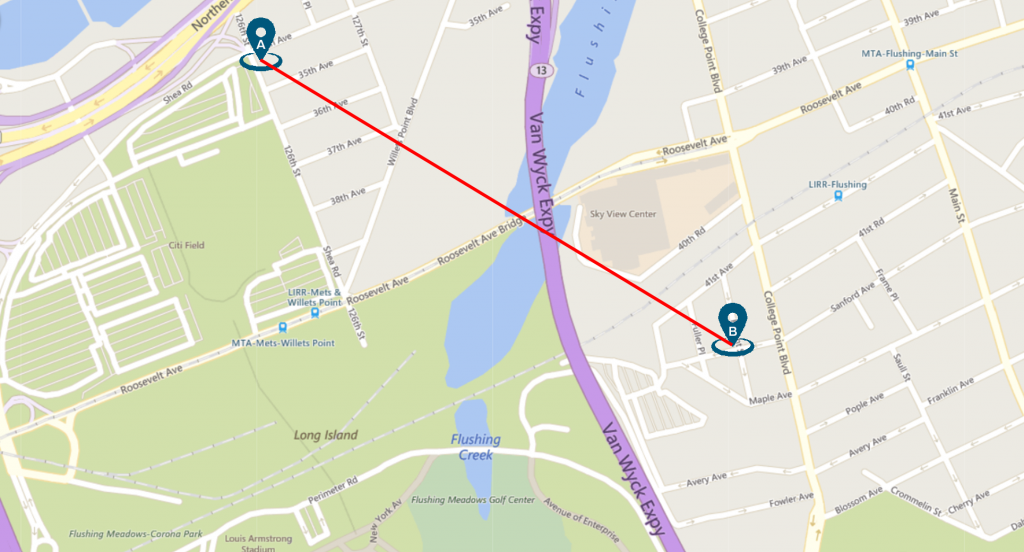
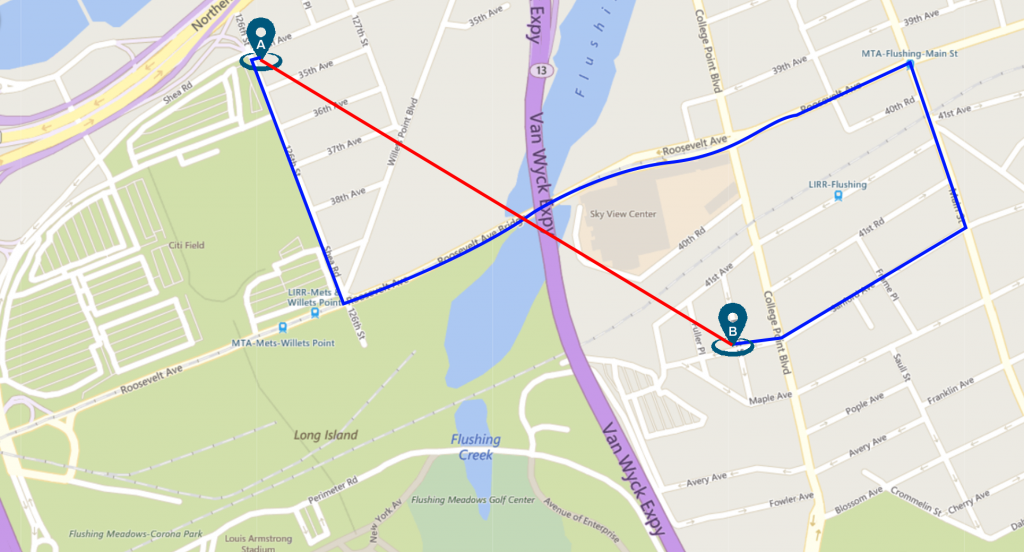
For example, from house A to house B, as the crow flies would be 1 mile, or a 20-minute walk. When we consider where people can walk, so not walking through buildings or over rivers, the walk becomes much longer.
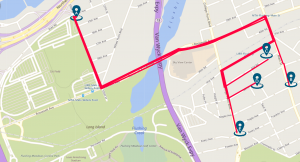
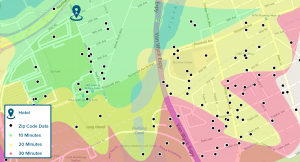
Now house A wants to go to a supermarket, TRACC can simultaneously calculate the time it takes to get from house A to multiple supermarkets, either by walking, cycling, public transit or car. TRACC shows these results with bands of travel time, called contours. Each band can be a customized time range, for example, 0-10 minutes, 10-20 minutes, 20-30 and so on…
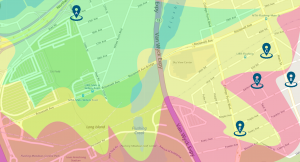 For this calculation, house A is actually a hotel, the business manager wants to know how many people can reach the hotel in 1 hour of public transit. TRACC uses the imported census data to attach population to where people live, the resulting contour shows which areas can travel to the hotel in an hour.
These calculations can be done on a small scale or on a massive scale, allowing a hotel manager to look at all their hotels in one go, providing detailed reporting. Previous accessibility runs of up to 70 million people have been completed using TRACC!
The tale of three cities
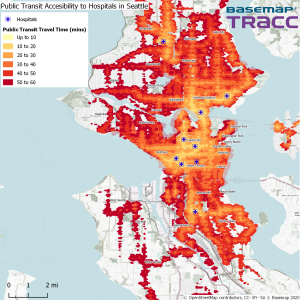
This case study is looking at three cities across the states: Seattle, Chicago and New York, and how accessible they are to hospitals and high schools. These calculations used population data tied to a 100m grid imported into TRACC as origin points and either hospitals or high schools as destinations. The high school calculation used only a selection of census data, looking at the accessibility for 15 to 19 year olds, as their age is relevant for a high school calculation. The contours shown below were created with the results from TRACC.
![]()
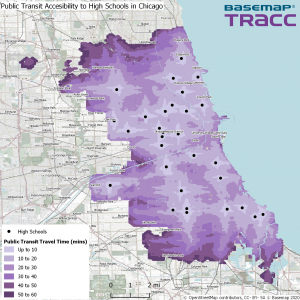
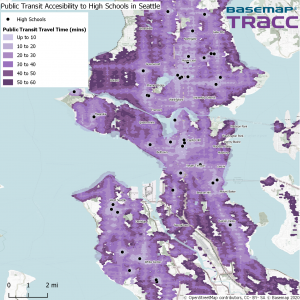
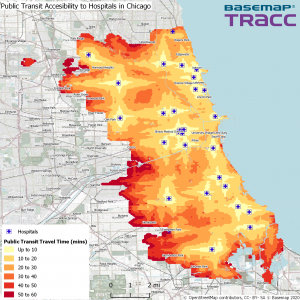
Using the legend shown, the lighter contour areas show greater accessibility, which in effect is a smaller travel time, and the darker areas show the travel time up to an hour. Where no contour shows, it could be for two reasons: it’s either the city boundary or the journey would take longer than 1 hour. These areas are in effect inaccessible so would require changes to the network. As expected, within a city center, most of the areas are accessible, but if this exercise was repeated state-wide, you would see access tail off in rural and suburban parts.
Numerical data can also be exported from TRACC, for example from these accessibility calculations, the percentage of the population that would able to reach a hospital or high school within 30 minutes. The table below breaks down these calculations for the contours.
| % Of people with accessibility within 30 minutes | Number of people with accessibility within 30 minutes | |||
| Location | To hospitals | To high schools | To hospitals | To high schools |
| Chicago | 83.76% | 88.86% | 2,555,015 | 159,433 |
| Seattle | 50.03% | 76.68% | 380,728 | 25,411 |
| New York | 94.64% | 97.63% | 8,127,200 | 453,471 |
The table can give a clearer picture of the contour. In Seattle, 50% of the population can reach a hospital in under 30 minutes, whereas in New York this figure is almost 95%. This is reflected in the contour with the large portions of read on the Seattle map and much more of the lightest shade on the New York map.
![]()
Looking at both the table and the contour, it is clear that Seattle is the least accessible in both categories. While accessibility across an hour looks pretty good for all three cities, when we look at just half hour access, Seattle performs less well. With many cities around the world aspiring to be 20 minutes cities, meaning you can get to key locations within 20-minute commute, it would be worthwhile using TRACC to look at making improvements to the public transit network.
Simulations of proposed bus and train routes could be run to determine the impact. This allows for investment to be allocated in the most effective way. TRACC is already being utlized in this way widely in the UK, for federal and local governments as well as private businesses.
To find out how other organisations are using TRACC, read our other case studies.
Basemap Ltd. established in 2000 and based in the UK, Basemap have been providing data and mapping solutions to public and private clients.