From Proximity to Opportunity
Measuring housing connectivity across Ithaca-Tompkins County
Being close to transit does not necessarily mean being well connected.
A resident may live near a bus route but still struggle to reach employment, education, healthcare or everyday services at the right time — or make the return journey home.
The Ithaca-Tompkins County Transportation Council (ITCTC) wanted a better way to understand this relationship between transportation, housing and access to opportunity.
Working with Basemap, ITCTC developed two new measures: the Transit Housing Accessibility Index (THAI) and Cycle Housing Accessibility Index (CHAI).
Turning local knowledge into a measurable index
Ithaca-Tompkins County combines the urban centre of Ithaca with smaller towns and rural communities. Cornell University and Ithaca College are major generators of employment and travel, creating a diverse transportation landscape.
ITCTC already had strong local knowledge of where connectivity worked well and where gaps existed. The challenge was turning that knowledge into a consistent measure that could be applied across the whole county.
Rather than using a generic accessibility score, ITCTC and Basemap built the methodology together.
ITCTC identified the destinations that matter locally, when people need to reach them and what represents a reasonable journey. Basemap then used TRACC to turn those requirements into a repeatable accessibility model.
What can people actually reach?
THAI goes beyond asking:
“Is this location close to transit?”
Instead, it asks:
“What can someone actually reach using that transit?”
The analysis included employment, schools, colleges, healthcare, food stores, parks, commercial centers, Downtown Ithaca, Cornell University and other important destinations.
Different destinations were given appropriate journey times, travel periods and weightings.
TRACC then analyzed millions of journeys and combined the results into a connectivity score from 0 to 100.
“There’s no universal definition of good accessibility. What matters is whether people can reach jobs, schools, healthcare, shopping and other destinations that are important in their daily lives. THAI and CHAI give us a way to measure that based on the realities of our community.”
Thomas Knipe
Director, Ithaca-Tompkins County Transportation Council
A journey has to work both ways
A key part of THAI is considering both directions of travel.
A resident may be able to reach a job or appointment in the morning, but if there is no practical journey home, that opportunity is not genuinely accessible.
ITCTC therefore assessed:
Inbound | Outbound | Worst Case
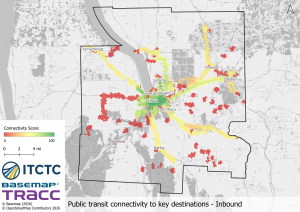
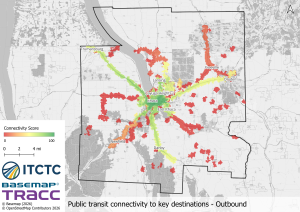
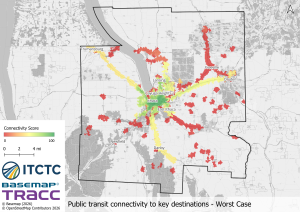
The analysis highlights Ithaca as the county’s strongest connectivity hub, alongside important corridors towards communities such as Trumansburg and Dryden.
It also exposes areas where one direction of travel significantly reduces accessibility, including around Newfield and Freeville.
How many people are well connected?
Combining the accessibility results with Census population data moves the analysis beyond showing where connectivity is good to understanding how many people benefit from it.
Preliminary public transit results
40% of the population receives a zero score in the Worst Case assessment.
41% achieves a Worst Case connectivity score above 60.
22% — around 23,440 people achieve a score above 90.
“Previously, local planners could see whether a location was served by transit, but not how well that service connected people to the places they need to go. By combining accessibility measures with population data, this analysis gives us a much clearer picture of who benefits from transit connectivity—and provides stronger evidence for futurehousing and transportation decisions.”
Thomas Knipe
Director, Ithaca-Tompkins County Transportation Council
Bringing cycling into the picture
ITCTC also wanted to understand the role of its extensive trail network.
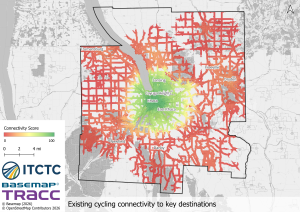
Using the same principles as THAI, the analysis was adapted for cycling to create the Cycle Housing Accessibility Index (CHAI).
The results show how cycling extends access beyond Ithaca and along important corridors into surrounding communities.
ITCTC also supplied two proposed additions to the trail network, allowing the same methodology to test how future investment could change accessibility.
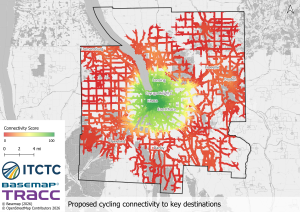
Proposed network impact
Existing: 57% / 60,350 people achieved a connectivity score above 50
Proposed: 57.2% / 60,500 people achieved a connectivity score above 50
Change: 10.8% of residents saw an improvement in connectivity
From proximity to opportunity
THAI and CHAI give ITCTC a practical framework for comparing potential housing locations, identifying gaps in transit provision and testing how proposed transportation improvements could change access across the county. They also help show where cycling can complement public transit and, crucially, how many people stand to benefit as networks evolve.
Instead of asking:
“Is this development close to transit?”
MPOs can ask:
“Can someone living here reach the opportunities they need — and can they get home again?”
By combining local knowledge, transportation networks, journey purpose, time of travel and Census data, ITCTC and Basemap are moving beyond simple measures of proximity to build a clearer picture of real access to opportunity
“TRACC has provided accessibility scores to us in a format that we can easily integrate with our GIS application to perform follow-on analysis. For example, we are planning to look at accessibility by different demographic characteristics such as income and ethnicity.”
Thomas Knipe
Director, Ithaca-Tompkins County Transportation Council
Banner image: ©2017 Kenneth C. Zirkel
Subscribe to Basemap's Latest News
Basemap Link